RSI Support & Resistance Breakouts with OrderblocksThis tool is an overly simplified method of finding market squeeze and breakout completely based on a dynamic RSI calculation. It is designed to draw out areas of price levels where the market is pushing back against price action leaving behind instances of short term support and resistance levels you otherwise wouldn't see with the common RSI.
It uses the changes in market momentum to determine support and resistance levels in real time while offering price zone where order blocks exist in the short term.
In ranging markets we need to know a couple things.
1. External Zone - It's important to know where the highs and lows were left behind as they hold liquidity. Here you will have later price swings and more false breakouts.
2. Internal Zone - It's important to know where the highest and lowest closing values were so we can see the limitations of that squeeze. Here you will find the stronger cluster of orders often seen as orderblocks.
In this tool I've added a 200 period Smoothed Moving Average as a trend filter which causes the RSI calculation to change dynamically.
Regular Zones - without extending
The Zones draw out automatically but are often too small to work with.
To solve this problem, you can extend the zones into the future up to 40 bars.
This allows for more visibility against future price action.
--------------------------------------------
Two Types of Zones
External Zones - These zones give you positioning of the highest and lowest price traded within the ranging market. This is where liquidity will be swept and often is an ultimate breaking point for new price swings.
How to use them :
External Zones - External zones form at the top of a pullback. After this price should move back into its impulsive wave.
During the next corrective way, if price breaches the top of the previous External Zone, this is a sign of trend weakness. Expect a divergence and trend reversal.
Internal Zones - (OrderBlocks) Current price will move in relation to previous internal zones. The internal zone is where a majority of price action and trading took place. It's a stronger SQUEEZE area. Current price action will often have a hard time closing beyond the previous Internal Zones high or low. You can expect these zones to show you where the market will flip over. In these same internal zones you'll find large rejection candles.
**Important Note** Size Doesn't Matter
The size of the internal zone does not matter. It can be very small and still very powerful.
Once an internal zone has been hit a few times, its often not relevant any longer.
Order Block Zone Examples
In this image you can see the Internal Zone that was untouched had a STRONG price reaction later on.
Internal Zones that were touched multiple times had weak reactions later as price respected them less over time.
Zone Overlay Breakdown
The Zones form and update in real time until momentum has picked up and price begins to trend. However it leaves behind the elements of the inducement area and all the key levels you need to know about for future price action.
Resistance Fakeout : Later on after the zone has formed, price will return to this upper zone of price levels and cause fakeouts. A close above this zone implies the market moves long again.
Midline Equilibrium : This is simply the center of the strongest traded area. We can call this the Point of Control within the orderblock. If price expands through both extremes of this zone multiple times in the future, it eliminates the orderblock.
Support Fakeout : Just like its opposing brother, price will wick through this zone and rip back causing inducement to trap traders. You would need a clear close below this zone to be in a bearish trend.
BARCOLOR or Candle Color: (Optional)
Bars are colored under three conditions
Bullish Color = A confirmed bullish breakout of the range.
Bearish Color = A confirmed bearish breakout of the range.
Squeeze Color = Even if no box is formed a candle or candles can have a squeeze color. This means the ranging market happened within the high and low of that singular candle.
在腳本中搜尋"order block"

Candlesticks Patterns [TradingFinder] Pin Bar Hammer Shooting🔵 Introduction
Truly, the title "TradingView" doesn't do justice to this excellent website, and that's why I've written about its crucial aspect. In this indicator, the identification of all candlesticks known as "Pin bars" is explored.
These candlesticks include the following:
- Hammer : A Pin bar formed at the end of a bearish trend, with its body being either bearish or bullish.
- Shooting Star : Formed at the end of a bullish trend, with its body being either bearish or bullish.
- Hanging Man : Formed during an upward trend, characterized by a candle with a lower shadow.
- Inverted Hammer : Formed during a downward trend, characterized by a candle with an upper shadow.
🟣 Important : For ease of use, we refer to these four candlestick patterns as Pin Bars and categorize them into the main friends "Bullish" and "Bearish."
🟣 Important : In all sources, Hanging Man and Inverted Hammer are referred to as "Reversal candles." However, in reality, whenever they appear after breaking a significant area (Break Out), we expect these candles to signal a continuation of the trend and confirmation in the direction of the trend.
🟣 Important : One of the best signs of market manipulation and entry by market giants is the "Ice Berg." So, it provides one of the best trading opportunities.
🔵 Reason for Creation
Many traders, especially volume traders, use Pin bars as confirmation and enter the market after their occurrence. In this indicator, all four patterns are identified and displayed in a colored candle format, using "triangle" and "circle."
When they are evident on the chart, directly or by drawing a horizontal line, they give us good alerts for reversal or continuation areas.
🔵 Information Table
1. Red circle: Pin bars formed in a downtrend.
2. Blue circle: Bullish Pin bars formed in an uptrend.
3. Black triangle: Bearish Pin bar candle in an uptrend.
4. Blue triangle: Bullish Pin bar candle in a downtrend.
🔵 Settings
Trend Detection Period: A special feature that considers smaller or larger fluctuations. If individual price waves need to be considered, use lower numbers; if the overall trend direction is desired, use larger numbers (e.g., 5-7 or higher). This precisely sets the Zigzag or Pivot format, not displayed but considered in the indicator calculation.
Trend Effect : By changing the Trend Effect status to "Off," all Pin bars, whether bullish or bearish, are displayed regardless of the current market trend. If the status remains "On," only Pin bars in the direction of the main market trend are shown.
🟣 Important : Black triangles "Number 3" and blue triangles "Number 4" displayed in the information table section, as explained in the "Information Table" section.
Show Bullish Pin Bar : When set to "Yes," displays bullish Pin bars; when set to "No," does not display them.
Show Bearish Pin Bar : When set to "Yes," allows the display of bearish Pin bars; when set to "No," does not display them.
Bullish Pin Bar Setting : Using the "Ratio Lower Shadow to Body" and "Ratio Lower Shadow to Higher Shadow" settings, you can customize your bullish Pin bar candles. Larger numbers impose stricter conditions for identifying bullish Pin bars.
Bearish Pin Bar Setting : Using the "Ratio Higher Shadow to Body" and "Ratio Higher Shadow to Lower Shadow" settings, you can customize your bearish Pin bar candles. Larger numbers impose stricter conditions for identifying bearish Pin bars.
Show Info Table : Allows the display or non-display of the information table (located at the bottom of the page and on the right side).
🔵 How to Use
At the end of a downtrend, look for "Hammer" candles, easily identified one by one.
To identify the "Shooting Star" candle pattern at the end of an uptrend; expect a price reversal in the downtrend.
For trades in the downward direction, wait for the formation of an "Inverted Hammer" Pin bar.
And finally, in an uptrend, where a "Hanging Man" candle can form.
🔵 Features
For better visualization, triangles and circles are used above the candles, but they can be easily removed. All Pin bars are displayed in color with the following meanings:
- Black-bodied candle: Inverted Hammer
- Turquoise blue candle: Hammer
- Pink candle: Hanging Man
- Red candle: Shooting Star
🟣 Important : The capability to detect the powerful two-candle pattern "Tweezer Top" at the end of an uptrend emerges by forming two "Shooting Star" candles side by side.
Similarly, the two-candle pattern "Tweezer Bottom" is created at the end of a downtrend with the formation of two "Hammer" candles side by side. To identify the "Tweezer" pattern, make sure the settings in the "Trend Effect" section are set to "Off."
🟣 Auxiliary Indicators
During the start of trading sessions such as Asia, London, and New York, where the highest liquidity exists, alongside this indicator, you can use the Trading Sessions indicator.
Sessions
The combination of Order Blocks "-OB" and "+OB" with candles is one of the best trading methods. The indicator that identifies order blocks, along with this indicator, can yield remarkable results in the success of Pin bar candles.
Order Blocks Finder
The trading toolset "TFlab" presents this indicator. To benefit from all indicators, we invite you to visit our page " TFlab Scripts ".

FVG + OB + RSI Divergence + Volume Spikes🧠 FVG + OB + RSI Divergence + Volume Spikes – Market Structure Confluence Tool
This all-in-one indicator brings together four powerful market concepts into a single script designed to help traders identify high-probability trade setups with precision and clarity:
🔍 What It Does
✅ Fair Value Gaps (FVG)
Highlights inefficiencies in price action, showing where the market may return to “rebalance.”
✅ Order Blocks (OB)
Marks key institutional footprints — bullish and bearish order blocks based on engulfing candle structures.
✅ RSI Divergence
Detects both bullish and bearish divergences between price and RSI, signaling potential reversals.
✅ Volume Spikes
Flags bars where volume significantly exceeds the average — a common footprint of smart money.
🎯 How to Use
Use this tool to spot confluences between price inefficiencies (FVG), key reversal zones (OB), momentum shifts (RSI Divergence), and institutional interest (Volume Spikes). The best setups often occur when multiple signals align — especially at key support/resistance or trend zones.
⚙️ Inputs
RSI length (for divergence)
Volume spike sensitivity (multiplier)
Lookback for Order Blocks and FVGs
⚠️ Notes
This is a non-repainting tool.
Ideal for price action, SMC, ICT, and order flow traders.
Combine with your existing strategy and higher time frame bias for best results.

Market Structure HH, HL, LH and LLMarket Structure Indicator (HH, HL, LH, LL) – Explanation and Usage
Overview:
This indicator is designed to detect and visualize market structure shifts by identifying Higher Highs (HH), Higher Lows (HL), Lower Highs (LH), and Lower Lows (LL). It plots a ZigZag structure to mark trend changes, helping traders analyze price swings and market direction.
Indicator Logic:
The indicator operates based on ZigZag swing points to define trend shifts and structure changes.
Identifying Market Swings:
It finds local highs and lows using the ZigZag Length (zigzag_len), which defines how many bars back to check for a new swing high/low.
If the current high is the highest over zigzag_len periods, it marks it as a swing high.
If the current low is the lowest over zigzag_len periods, it marks it as a swing low.
Determining Market Structure:
Uptrend: Higher Highs (HH) & Higher Lows (HL)
Downtrend: Lower Lows (LL) & Lower Highs (LH)
The script continuously tracks the last two highs (h0, h1) and last two lows (l0, l1) to classify the current market structure.
Visual Elements:
ZigZag Line (Optional): Connects major swing highs and lows for trend visualization.
Labels (HH, HL, LH, LL):
HH (Higher High) – Price is making new highs → Uptrend Continuation.
HL (Higher Low) – Price forms a higher bottom → Uptrend Confirmation.
LL (Lower Low) – Price is making new lows → Downtrend Continuation.
LH (Lower High) – Price forms a lower top → Downtrend Confirmation.
Breakout Confirmation with Fibonacci Factor (Optional)
The indicator includes an option to confirm breakouts using the fib_factor, which ensures price moves beyond a certain retracement level.
How to Use This Indicator in Trading:
1. Identifying Trends & Trend Reversals
Uptrend: Look for a sequence of HH and HL.
Downtrend: Look for a sequence of LL and LH.
Trend Reversal: If price transitions from HH-HL to LH-LL, it signals a shift from an uptrend to a downtrend (and vice versa).
2. Confirming Entry & Exit Points
Buy Entry (Long Position)
Enter after a Higher Low (HL) is confirmed in an uptrend.
Combine with support zones or moving averages for confirmation.
Sell Entry (Short Position)
Enter after a Lower High (LH) is confirmed in a downtrend.
Combine with resistance zones or moving averages for confirmation.
Exit Strategy
Exit long trades when price fails to make a HH and forms an LH instead.
Exit short trades when price fails to make a LL and forms an HL instead.
3. Spotting Breakouts & Order Blocks
The Fib Factor setting allows traders to filter false breakouts by confirming price movement beyond a retracement threshold.
Potential Order Blocks can be identified by looking at the last major swing point before a breakout.
Benefits of This Indicator for Traders
✅ Trend Identification: Helps traders quickly determine if the market is in an uptrend or downtrend.
✅ Clear Market Structure Labels: Easily visualizes Higher Highs, Higher Lows, Lower Highs, and Lower Lows.
✅ Avoids Noise: The ZigZag algorithm removes small fluctuations and focuses on significant market movements.
✅ Assists with Entry & Exit Decisions: Provides objective signals for trend continuation or reversals.
✅ Works in All Markets: Useful for stocks, forex, crypto, and futures trading.
Would you like me to add additional features like Order Blocks, Breakout Confirmation, or Alerts to improve this indicator? 🚀

Market Structure Break Targets [UAlgo]The "Market Structure Break Targets " indicator is designed to identify and visualize key market structure points such as Market Structure Breaks (MSBs) and Break of Structures (BoS). These points are crucial for understanding market trends and potential reversal zones. By plotting these structures on the chart, traders can easily spot significant support and resistance levels, as well as potential entry and exit points.
This indicator uses a combination of swing highs and lows to determine market structures and calculates targets based on user-defined percentages or Average True Range (ATR) multipliers. It provides visual cues in the form of lines, labels, and boxes to help traders quickly interpret market conditions.
🔶 Key Features
Customizable Swing Length: Users can set the swing length to identify the pivot highs and lows, which are crucial for determining market structure.
Target Duration Bars: Defines the maximum duration (in bars) for which the targets will be considered valid.
Target Calculation Methods: The target levels are crucial for setting potential price objectives. The calculation can be based on a percentage move from the identified pivot or using the ATR to factor in market volatility. These targets help in setting realistic profit-taking levels or identifying stop-loss placements.
Bullish and Bearish Market Structure Break (MSB): Detects and highlights bullish and bearish market structure breaks with customizable colors and target percentages.
Bullish MSB
When the price closes above a significant pivot high, a bullish MSB is identified. The indicator will draw a line at this level and calculate a target based on the chosen method (percentage or ATR). The target is visualized with a dotted line, and a label "MSB" is displayed. Additionally, an order block is created at the level of the bullish MSB. This order block is highlighted with a semi-transparent box, representing a potential area where price might find support in the future.
Bearish MSB
Conversely, when the price closes below a significant pivot low, a bearish MSB is marked. Similar to bullish MSBs, targets are calculated and displayed on the chart. An order block is also generated at the level of the bearish MSB, visualized with a semi-transparent box. This box highlights a potential resistance area where price might face selling pressure.
Bullish and Bearish Break of Structure (BoS): Identifies break of structures for both bullish and bearish scenarios, providing additional target levels.
Bullish BoS
If the price continues to rise and breaks another significant level, a bullish BoS is detected. This break is also marked with lines and labels, providing additional target levels for traders. An order block is created at the BoS level, serving as a potential support zone.
Bearish BoS
If the price falls further after a bearish MSB, a bearish BoS is identified and visualized similarly. The indicator creates an order block at the BoS level, which acts as a potential resistance zone.
🔶 Disclaimer:
Use with Caution: This indicator is provided for educational and informational purposes only and should not be considered as financial advice. Users should exercise caution and perform their own analysis before making trading decisions based on the indicator's signals.
Not Financial Advice: The information provided by this indicator does not constitute financial advice, and the creator (UAlgo) shall not be held responsible for any trading losses incurred as a result of using this indicator.
Backtesting Recommended: Traders are encouraged to backtest the indicator thoroughly on historical data before using it in live trading to assess its performance and suitability for their trading strategies.
Risk Management: Trading involves inherent risks, and users should implement proper risk management strategies, including but not limited to stop-loss orders and position sizing, to mitigate potential losses.
No Guarantees: The accuracy and reliability of the indicator's signals cannot be guaranteed, as they are based on historical price data and past performance may not be indicative of future results.

Math by Thomas - SMC OB + FVG📄 Description
This script is designed for traders following the Smart Money Concepts (SMC) methodology. It automatically detects:
✅ Bullish and Bearish Order Blocks (OBs) based on structural breakouts, displacement, and volume conditions.
✅ Fair Value Gaps (FVGs) using a 3-candle price imbalance model.
🔄 Both OBs and FVGs clean up dynamically when invalidated by price action.
Built with institutional logic, this tool helps identify areas of interest for potential reversals, liquidity grabs, or mitigation plays.
⚙️ How It Works
🔷 Order Blocks (OB)
A Bullish OB is marked after a Break of Structure (BOS) to the upside.
A Bearish OB is marked after BOS to the downside.
Filters like displacement candle and volume spike can be toggled in settings.
Boxes are drawn from the opposing candle in the move, and will disappear once broken or expired.
🟥 Fair Value Gaps (FVG)
FVGs are detected when the middle candle leaves a price imbalance between the first and third candle.
Zones are marked with transparent boxes.
Labels (FVG) appear only once every 20 bars to reduce clutter.
Gaps are removed only after a full candle closes through the zone (conservative logic).
🛠️ User Settings
Choose volume multiplier and ATR period for OB displacement logic.
Set box extension, label transparency, and cleanup behavior.
Full control over colors and midline display.
📈 How to Use
Apply the indicator to any chart (works best on indices, forex, crypto).
Use OBs as points of interest for potential reaction zones or mitigation setups.
Use FVGs to identify imbalances that may attract price.
Watch for confluence between OBs and FVGs for high-probability entries.
📚 Best Practice
Use on 15m–1h timeframe for clean structure.
Align with higher TF bias for direction.
Combine with liquidity sweeps, EQH/EQL, or breaker blocks for refinement.

Swing Pivots [UkutaLabs]█ OVERVIEW
The Swing Pivots indicator uses relevant price-action information to identify key levels of Support and Resistance. Traders will be able to use current day Swing Pivots as well as mirror higher time frame Swing Pivots to gain a stronger understanding of overall market strength and key levels.
The aim of this script is to improve the users trading experience by offering a versatile toolkit that can be used in a wide variety of trading strategies to help simplify the complexities of the market.
█ USAGE
Throughout the trading day, the script will automatically identify key High and Low levels in the market based on currently relevant price action information, giving users potentially strong support and resistance levels which serve to guide the trader throughout the complexities in the market.
The script will also Identify powerful Order Blocks which are clusters of orders executed at a specific price level which represent an imbalance between supply and demand. By identifying Order Blocks, the script can indicate valuable supply and demand zones which help signal potential market turning points for the trader.
Furthermore, the script allows the user to mirror higher time frame Swing Pivots onto lower time frame charts to gain a stronger understanding of overall market strength and key levels on multiple time frames from a single chart.
█ SETTINGS
Configuration
Pivot Strength: Determines the sensitivity of the pivot calculation. A higher strength will result in less pivots being drawn, and a lower strength will result in more pivots being drawn.
Current Time frame
• Display: Determines whether or not Swing Pivots from the current time frame will be drawn on the chart.
5 Minute (Higher Time Frame)
• Display: Determines whether or not Swing Pivots from the 5 minute time frame will be drawn on the chart.
15 Minute (Higher Time Frame)
• Display: Determines whether or not Swing Pivots from the 15 minute time frame will be drawn on the chart.
30 Minute (Higher Time Frame)
• Display: Determines whether or not Swing Pivots from the 30 minute time frame will be drawn on the chart.
1 Hour (Higher Time Frame)
• Display: Determines whether or not Swing Pivots from the 1 hour time frame will be drawn on the chart.
4 Hour (Higher Time Frame)
• Display: Determines whether or not Swing Pivots from the 4 hour time frame will be drawn on the chart.
Daily (Higher Time Frame)
• Display: Determines whether or not Swing Pivots from the daily time frame will be drawn on the chart.

Higher Timeframe Market StructureHTF Market Structure – ZigZag, Break of Structure & Supply/Demand
This powerful indicator is designed to identify higher-timeframe market structure using a combination of ZigZag patterns, Break of Structure (BOS) signals, and Supply/Demand zones.
Key Features:
Automatic detection of Higher Highs (HH), Higher Lows (HL), Lower Lows (LL), and Lower Highs (LH)
Internal structure shifts based on Open or High/Low logic
Supply and Demand zones plotted on the chart
Break of Structure (BOS) lines with optional alerts
Mitigation logic to mark or delete invalidated order blocks
Customizable aggregation factor to view higher time frame structure on lower time frames
How to Use:
Focus on market structure and BOS to understand the current trend.
Watch for internal shifts as early signals of potential reversals.
Use ZigZag lines to connect swing highs and lows to visualize market rhythm.
Supply zones (red) and Demand zones (green) are automatically drawn after structure breaks:
Use Demand Zones in Bullish Markets for the highest probability entries.
Use Supply Zones in Bearish Markets to align with the prevailing trend.
Best Practices:
Only use Demand Zones in Bullish markets and Supply Zones in Bearish markets for optimal results.
Look for price action or reversal signals within these zones to refine your entries.
Enable alerts to get notified on:
New order blocks
Internal shifts
BOS events
HH, HL, LL, LH formations
Liquidity sweeps
Customization Options:
Aggregation Factor: Control how many candles are grouped for structure analysis.
Zone Duration: Define how length of plotted zones.
Mitigation Settings: Automatically delete or fade zones after mitigation.
Colors: Choose custom colors for bullish and bearish zones and structure markers.
This tool is ideal for traders who rely on price action, structure, and smart money concepts. Combine it with your own S&D strategy or integrate it with other confluence tools for even better precision.

OB Sweeps ReversalOB Sweeps Reversal is a high-precision market structure tool that identifies and dynamically tracks bullish and bearish order blocks — key zones where institutional participants are likely to be active. These zones act as support and resistance levels, adapting to market behavior in real time.
The script monitors price interaction with each OB and classifies its status as:
Unmitigated (price has not yet returned)
Mitigating (price is testing the zone)
Invalidated (zone has been broken)
Traders can use these zones directly as actionable support/resistance — or wait for additional confirmation via the system’s liquidity sweep detection and optional filters.
🔍 Key Features:
Automatically detects and plots bullish and bearish OBs
Tracks mitigation status and updates visuals accordingly
Detects liquidity sweeps of recent highs/lows
Optional filters:
• 200 EMA trend direction
• Momentum of current or previous candle
Plots stop-loss and take-profit lines using ATR-based logic
Clean entry labels with full contextual data
Built-in alert system with constant-string messages (automation ready)
📈 How to Use:
Load the script on any timeframe (15m–4H recommended)
Observe the live OB zones as they develop
Trade based on price interaction:
• Bounce off a bullish OB = potential long setup
• Rejection from a bearish OB = potential short
• Sweep + snapback into an OB = optional trap reversal entry
SL/TP levels are drawn automatically for reference
Use alerts to automate or monitor high-conviction setups
The order blocks themselves are valuable on their own — even without waiting for a signal. They can be used as dynamic support and resistance zones, offering excellent structure-based trading opportunities.
🧠 Ideal For:
Traders who follow price action and market structure
Those using support/resistance, OBs, or supply/demand
Intraday and swing traders looking for cleaner structure alignment
Users who prefer low-frequency, high-quality setups
⚠️ Note:
This tool does not produce frequent signals. It is designed for precision and discipline, with a focus on clarity and confluence. It complements — not replaces — a trader’s decision-making process.
This script is open-source and designed with integrity, precision, and trader usability in mind. No links, no upsells, no promotions — just a reliable system for structural market analysis.

Time-Based Fair Value Gaps (FVG) with Inversions (iFVG)Overview
The Time-Based Fair Value Gaps (FVG) with Inversions (iFVG) (ICT/SMT) indicator is a specialized tool designed for traders using Inner Circle Trader (ICT) methodologies. Inspired by LuxAlgo's Fair Value Gap indicator, this script introduces significant enhancements by integrating ICT principles, focusing on precise time-based FVG detection, inversion tracking, and retest signals tailored for institutional trading strategies. Unlike LuxAlgo’s general FVG approach, this indicator filters FVGs within customizable 10-minute windows aligned with ICT’s macro timeframes and incorporates ICT-specific concepts like mitigation, liquidity grabs, and session-based gap prioritization.
This tool is optimized for 1–5 minute charts, though probably best for 1 minute charts, identifying bullish and bearish FVGs, tracking their mitigation into inverted FVGs (iFVGs) as key support/resistance zones, and generating retest signals with customizable “Close” or “Wick” confirmation. Features like ATR-based filtering, optional FVG labels, mitigation removal, and session-specific FVG detection (e.g., first FVG in AM/PM sessions) make it a powerful tool for ICT traders.
Originality and Improvements
While inspired by LuxAlgo’s FVG indicator (credit to LuxAlgo for their foundational work), this script significantly extends the original concept by:
1. Time-Based FVG Detection: Unlike LuxAlgo’s continuous FVG identification, this script filters FVGs within user-defined 10-minute windows each hour (:00–:10, :10–:20, etc.), aligning with ICT’s emphasis on specific periods of institutional activity, such as hourly opens/closes or kill zones (e.g., New York 7:00–11:00 AM EST). This ensures FVGs are relevant to high-probability ICT setups.
2. Session-Specific First FVG Option: A unique feature allows traders to display only the first FVG in ICT-defined AM (9:30–10:00 AM EST) or PM (1:30–2:00 PM EST) sessions, reflecting ICT’s focus on initial market imbalances during key liquidity events.
3. ICT-Driven Mitigation and Inversion Logic: The script tracks FVG mitigation (when price closes through a gap) and converts mitigated FVGs into iFVGs, which serve as ICT-style support/resistance zones. This aligns with ICT’s view that mitigated gaps become critical reversal points, unlike LuxAlgo’s simpler gap display.
4. Customizable Retest Signals: Retest signals for iFVGs are configurable for “Close” (conservative, requiring candle body confirmation) or “Wick” (faster, using highs/lows), catering to ICT traders’ need for precise entry timing during liquidity grabs or Judas swings.
5. ATR Filtering and Mitigation Removal: An optional ATR filter ensures only significant FVGs are displayed, reducing noise, while mitigation removal declutters the chart by removing filled gaps, aligning with ICT’s principle that mitigated gaps lose relevance unless inverted.
6. Timezone and Timeframe Safeguards: A timezone offset setting aligns FVG detection with EST for ICT’s New York-centric strategies, and a timeframe warning alerts users to avoid ≥1-hour charts, ensuring accuracy in time-based filtering.
These enhancements make the script a distinct tool that builds on LuxAlgo’s foundation while offering ICT traders a tailored, high-precision solution.
How It Works
FVG Detection
FVGs are identified when a candle’s low is higher than the high of two candles prior (bullish FVG) or a candle’s high is lower than the low of two candles prior (bearish FVG). Detection is restricted to:
• User-selected 10-minute windows (e.g., :00–:10, :50–:60) to capture ICT-relevant periods like hourly transitions.
• AM/PM session first FVGs (if enabled), focusing on 9:30–10:00 AM or 1:30–2:00 PM EST for key market opens.
An optional ATR filter (default: 0.25× ATR) ensures only gaps larger than the threshold are displayed, prioritizing significant imbalances.
Mitigation and Inversion
When price closes through an FVG (e.g., below a bullish FVG’s bottom), the FVG is mitigated and becomes an iFVG, plotted as a support/resistance zone. iFVGs are critical in ICT for identifying reversal points where institutional orders accumulate.
Retest Signals
The script generates signals when price retests an iFVG:
• Close: Triggers when the candle body confirms the retest (conservative, lower noise).
• Wick: Triggers when the candle’s high/low touches the iFVG (faster, higher sensitivity). Signals are visualized with triangular markers (▲ for bullish, ▼ for bearish) and can trigger alerts.
Visualization
• FVGs: Displayed as colored boxes (green for bullish, red for bearish) with optional “Bull FVG”/“Bear FVG” labels.
• iFVGs: Shown as extended boxes with dashed midlines, limited to the user-defined number of recent zones (default: 5).
• Mitigation Removal: Mitigated FVGs/iFVGs are removed (if enabled) to keep the chart clean.
How to Use
Recommended Settings
• Timeframe: Use 1–5 minute charts for precision, avoiding ≥1-hour timeframes (a warning label appears if misconfigured).
• Time Windows: Enable :00–:10 and :50–:60 for hourly open/close FVGs, or use the “Show only 1st presented FVG” option for AM/PM session focus.
• ATR Filter: Keep enabled (multiplier 0.25–0.5) for significant gaps; disable on 1-minute charts for more FVGs during volatility.
• Signal Preference: Use “Close” for conservative entries, “Wick” for aggressive setups.
• Timezone Offset: Set to -5 for EST (or -4 for EDT) to align with ICT’s New York session.
Trading Strategy
1. Macro Timeframes: Focus on New York (7:00–11:00 AM EST) or London (2:00–5:00 AM EST) kill zones for high institutional activity.
2. FVG Entries: Trade bullish FVGs as support in uptrends or bearish FVGs as resistance in downtrends, especially in :00–:10 or :50–:60 windows.
3. iFVG Retests: Enter on retest signals (▲/▼) during liquidity grabs or Judas swings, using “Close” for confirmation or “Wick” for speed.
4. Session FVGs: Use the “Show only 1st presented FVG” option to target the first gap in AM/PM sessions, often tied to ICT’s market maker algorithms.
5. Risk Management: Combine with ICT concepts like order blocks or breaker blocks for confluence, and set stops beyond FVG/iFVG boundaries.
Alerts
Set alerts for:
• “Bullish FVG Detected”/“Bearish FVG Detected”: New FVGs in selected windows.
• “Bullish Signal”/“Bearish Signal”: iFVG retest confirmations.
Settings Description
• Show Last (1–100, default: 5): Number of recent iFVGs to display. Lower values reduce clutter.
• Show only 1st presented FVG : Limits FVGs to the first in 9:30–10:00 AM or 1:30–2:00 PM EST sessions (overrides time window checkboxes).
• Time Window Checkboxes: Enable/disable FVG detection in 10-minute windows (:00–:10, :10–:20, etc.). All enabled by default.
• Signal Preference: “Close” (default) or “Wick” for iFVG retest signals.
• Use ATR Filter: Enables ATR-based size filtering (default: true).
• ATR Multiplier (0–∞, default: 0.25): Sets FVG size threshold (higher values = larger gaps).
• Remove Mitigated FVGs: Removes filled FVGs/iFVGs (default: true).
• Show FVG Labels: Displays “Bull FVG”/“Bear FVG” labels (default: true).
• Timezone Offset (-12 to 12, default: -5): Aligns time windows with EST.
• Colors: Customize bullish (green), bearish (red), and midline (gray) colors.
Why Use This Indicator?
This indicator empowers ICT traders with a tool that goes beyond generic FVG detection, offering precise, time-filtered gaps and inversion tracking aligned with institutional trading principles. By focusing on ICT’s macro timeframes, session-specific imbalances, and customizable signal logic, it provides a clear edge for scalping, swing trading, or reversal setups in high-liquidity markets.

ICT SMC Liquidity Grabs and OBsICT SMC Liquidity Grabs + OB + Fibonacci OTE Levels
Smart Money Concepts Trading Assistant
This script is built for traders who follow ICT (Inner Circle Trader) and Smart Money Concepts. It intelligently combines three critical components of SMC trading: Liquidity Grabs, Order Blocks, and Fibonacci-based Optimal Trade Entry (OTE) zones — giving traders visual cues for potential high-probability reversals and entry points.
🔍 What This Script Does:
Detects Liquidity Grabs
Identifies swing highs/lows where price sweeps liquidity, then immediately reverses.
Labels them with orange markers when price takes out previous highs/lows but closes back inside.
Draws Order Blocks
After a liquidity grab, the script looks for strong bullish or bearish candles and automatically highlights the OB zone.
These OB zones are visualized with transparent colored boxes extending several bars forward.
Plots Fibonacci OTE Levels
Uses recent swing high/low pivots to dynamically draw customizable OTE retracement levels (e.g., 62% and 75%) for both long and short setups.
Highlights Optimal Entry Zones
Marks valid OTE-based buy/sell opportunities only when:
Liquidity has been taken,
Price enters the OTE zone,
And a strong confirming candle appears.
Adds visual zones, trade labels, and optional alerts for each qualified entry.
Includes Take Profit Targets
Automatically calculates take-profit levels based on previous structure and risk-reward ratios.
TP1 is the previous swing, and TP2 is an extended R-multiple (customizable by user).
⚙️ Customization Options:
Toggle each feature (Liquidity Grabs, OBs, Fibonacci Levels)
Adjust Fibonacci levels (default: 62% and 75%)
Set lookback period for liquidity checks
Customize the R-multiple for TP2 levels
💡 How to Use:
Enable desired features from the input panel.
Watch for Buy/Sell OTE zones highlighted in green/red.
Confirm with liquidity sweep and OB support for stronger signals.
Use the automatically generated TP levels to manage risk.
🚀 What Makes It Unique:
Unlike other open-source mashups, this script synchronizes multiple SMC concepts into a single tool that:
Waits for high-confidence conditions (not just blind fib or OB detection)
Validates entries using multiple confluences
Visually marks actionable setups
Automates trade management zones
Whether you're trend-trading, scalping, or swing trading ICT-style, this tool offers a streamlined, smart-money-aligned workflow directly on your chart.

Ichimoku Ervin Ichimoku Ervin Indicator Version 2.47
This advanced Ichimoku indicator, version 2.47, is presented with a special design and settings that help improve the accuracy of technical analysis. The most important features of this version are:
Dual Ichimoku Plotting with Different Periods:
This indicator simultaneously draws two Ichimoku sets:
First set with a period of 26 (26-period cloud)
Second set with a period of 0 (0 cloud)
The 0 cloud feature allows the analyst to shift the position of this cloud forward or backward at will (e.g., 9 or 18 periods ahead or behind the current candle), depending on their trading strategy, to identify more sensitive areas of the chart for analyzing the market’s future or reviewing its past. This capability provides the user with a deeper understanding of trend behavior and its strength.
Period Settings:
The main periods of this indicator are defined as:
103, 216, 63, and 540
Additionally, the value 540 performs with higher sensitivity specifically on the 1-hour (H1) time frame and lower, providing the analyst with faster and more accurate signals.
Time Cycles:
This indicator includes three key time cycles: 9, 26, and 52 periods, each representing different phases of the market and potential points for trend reversal.
accurately identify both short-term and long-term trends Two Exponential Moving Averages (EMA):
It uses two EMAs with periods of 50 and 1440, where 1440 operates more sensitively on the 1-hour time frame and lower, helping the analyst to.
Order Block (OB):
One of the key features of this version is the display of Order Block (OB) zones. These are areas on the chart where high trading volumes and major decision-making by large traders (such as banks and financial institutions) have occurred.
Accurate identification of these zones helps traders choose more optimal entry and exit points and significantly reduce their trading risk.
This indicator has been released on the occasion of Eid al-Ghadir Khumm, and version 2.47 comes with special features. A professional tool for more precise market analysis. Happy Eid! 🌸

Fibonacci Optimal Entry Zone [OTE] (Zeiierman)█ Overview
Fibonacci Optimal Entry Zone (Zeiierman) is a high-precision market structure tool designed to help traders identify ideal entry zones during trending markets. Built on the principles of Smart Money Concepts (SMC) and Fibonacci retracements, this indicator highlights key areas where price is most likely to react — specifically within the "Golden Zone" (between the 50% and 61.8% retracement).
It tracks structural pivot shifts (CHoCH) and dynamically adjusts Fibonacci levels based on real-time swing tracking. Whether you're trading breakouts, pullbacks, or optimal entries, this tool brings unparalleled clarity to structure-based strategies.
Ideal for traders who rely on confluence, this indicator visually synchronizes swing highs/lows, market structure shifts, Fibonacci retracement levels, and trend alignment — all without clutter or lag.
⚪ The Structural Assumption
Price moves in waves, but key retracements often lead to continuation or reversal — especially when aligned with structure breaks and trend shifts.
The Optimal Entry Zone captures this behavior by anchoring Fibonacci levels between recent swing extremes. The most powerful area — the Golden Zone — marks where institutional re-entry is likely, providing traders with a sniper-like roadmap to structure-based entries.
█ How It Works
⚪ Structure Tracking Engine
At its core, the indicator detects pivots and classifies trend direction:
Structure Period – Determines the depth of pivots used to detect swing highs/lows.
CHoCH – Break of structure logic identifies where the trend shifts or continues, marked visually on the chart.
Bullish & Bearish Modes – Independently toggle uptrend and downtrend detection and styling.
⚪ Fibonacci Engine
Upon each confirmed structural shift, Fibonacci retracement levels are projected between swing extremes:
Custom Levels – Choose which retracements (0.50, 0.618, etc.) are shown.
Real-Time Adjustments – When "Swing Tracker" is enabled, levels and labels update dynamically as price forms new swings.
Example:
If you disable the Swing Tracker, the Golden Level is calculated using the most recent confirmed swing high and low.
If you enable the Swing Tracker, the Golden Level is calculated from the latest swing high or low, making it more adaptive as the trend evolves in real time.
█ How to Use
⚪ Structure-Based Entry
Wait for CHoCH events and use the resulting Fibonacci projection to identify entry points. Enter trades as price taps into the Golden Zone, especially when confluence forms with swing structure or order blocks.
⚪ Real-Time Reaction Tracking
Enable Swing Tracker to keep the tool live — constantly updating zones as price shifts. This is especially useful for scalpers or intraday traders who rely on fresh swing zones.
█ Settings
Structure Period – Number of bars used to define swing pivots. Larger values = stronger structure.
Swing Tracker – Auto-updates fib levels as new highs/lows form.
Show Previous Levels – Keep older fib zones on chart or reset with each structure shift.
-----------------
Disclaimer
The content provided in my scripts, indicators, ideas, algorithms, and systems is for educational and informational purposes only. It does not constitute financial advice, investment recommendations, or a solicitation to buy or sell any financial instruments. I will not accept liability for any loss or damage, including without limitation any loss of profit, which may arise directly or indirectly from the use of or reliance on such information.
All investments involve risk, and the past performance of a security, industry, sector, market, financial product, trading strategy, backtest, or individual's trading does not guarantee future results or returns. Investors are fully responsible for any investment decisions they make. Such decisions should be based solely on an evaluation of their financial circumstances, investment objectives, risk tolerance, and liquidity needs.

Sniper OB + FVG + BOS [GC/NQ/ES]📌 Indicator Name:
Sniper OB + FVG + BOS
🧠 Description:
The Sniper OB + FVG + BOS indicator is a precision trading tool built for traders who use Smart Money Concepts to catch high-probability setups across Gold (GC1), NASDAQ (NQ), and S&P 500 (ES).
This all-in-one script detects:
🔶 Fair Value Gaps (FVG) – Institutional imbalances based on price inefficiencies
🟥 Order Blocks (OB) – Bullish and bearish blocks based on engulfing structures
✅ Breaks of Structure (BOS) – Key confirmation of market direction
⏱️ Multi-Timeframe Compatible – Built to align setups across 4H, 1H, 15M, and 5M
Perfect for:
🟡 Gold Futures (GC1)
🔵 NASDAQ (NQ)
🔴 S&P 500 (ES)
And fully customizable via user-friendly toggles.
🎯 Use Cases:
Spot sniper entry zones with structure and imbalance confluence
Avoid low-probability trades in consolidation zones
Get visual confirmation for funded challenges or prop firm rules
Adapt to both swing and intraday strategies using clean, rule-based logic
🔧 Key Features:
Visual plot of FVGs, OBs, BOS directly on your chart
Works across any asset or timeframe
No repainting zones
Clean overlays that don’t clutter your chart
Built by a Topstep trader for precision execution
💡 Best For:
Funded account traders
SMC/ICT-inspired traders
Gold and index scalpers
Anyone who wants visual clarity and smart automation

US30 Smart Money 5M/4H Strategy🧠 How It Works
✅ 1. 4H Trend Bias Detection
Uses the 4-hour chart (internally) to determine if the market is in an uptrend or downtrend.
Background turns green for bullish trend, red for bearish trend.
This helps filter trades — only take longs during uptrend, shorts during downtrend.
✅ 2. Liquidity Sweeps (Stop Hunts) on 5M
Highlights candles that break previous highs/lows and then reverse (typical of institutional stop raids).
Draws a shaded red box above sweep-high candles and green box under sweep-lows.
These indicate key reversal zones.
✅ 3. Order Block Zones
Detects bullish/bearish engulfing patterns after liquidity sweeps.
Draws a supply or demand zone box extending forward.
These zones show where institutions likely placed large orders.
✅ 4. FVG Midpoint from 30-Min Chart
Detects Fair Value Gaps (imbalances) on the 30-minute chart.
Plots a line at the midpoint of the gap (EQ level), which is often revisited for entries or rejections.
✅ 5. Buy/Sell Signals (Non-Repainting)
Buy = 4H uptrend + 5M liquidity sweep low + bullish engulfing candle.
Sell = 4H downtrend + 5M liquidity sweep high + bearish engulfing.
Prints green “BUY” or red “SELL” label on the chart — these do not repaint.
📈 How to Use It
Wait for trend bias — only take trades in the direction of the 4H trend.
Watch for liquidity sweep boxes — these hint a stop hunt just occurred.
Look for a signal label (BUY/SELL) — confirms entry criteria.
Use FVG EQ lines & Order Block zones as confluence or targets.
Take trades after NY open (9:30 AM EST) for best momentum.

Liquidity Levels (Smart Swing Lows)Liquidity Levels — Smart Swing Low Detection
Efficient Liquidity Sweep Visualization for Smart Money Traders
This script automatically identifies and plots liquidity-rich swing lows based on pivot logic, filters them to remove redundant levels, and overlays daily highs/lows for added context — giving Smart Money Concept (SMC) traders a clean, actionable map of liquidity.
It’s designed to be minimal yet powerful: perfect for spotting potential liquidity grabs, mitigation zones, and sweep targets with zero chart clutter.
🔍 What This Script Does:
Detects Smart Swing Lows
Uses fixed pivot detection (left = 3, right = customizable) to identify structurally significant swing lows.
Filters out swing lows that are too close together using a percentage-based spacing threshold to reduce noise.
Mitigation Cleanup Logic
Tracks whether recent price action breaches past swing lows.
If breached, the swing level is automatically removed, keeping only relevant, unmitigated liquidity levels on your chart.
Plots Daily Highs and Lows
Each new trading day, horizontal rays mark the prior day’s high and low — useful for identifying resting liquidity and possible sweep zones.
Labeling and Style Customization
Optional labels for swing lows.
Full control over label size, color, and visibility to match any chart aesthetic.
Timeframe Filtering
Runs exclusively on 5m, 10m, and 15m charts to ensure optimal reliability and signal clarity.
⚙️ Customization Features:
Pivot sensitivity (Right side control)
Minimum distance between swing lows (in %)
Label visibility, size, and color
Line width and colors for both swing levels and daily highs/lows
Mitigation cleanup lookback length
💡 How to Use:
Add the script to a qualifying intraday chart (5–15m).
Use the swing low levels to monitor liquidity-rich zones.
Combine with your personal strategy to identify liquidity grabs, potential reversal zones, or entry points following a sweep.
Let the built-in cleanup logic remove any already-mitigated levels so you can focus on active targets.
🚀 What Makes It Unique:
This isn’t just another pivot plotter — it’s a smart, self-cleaning SMC tool designed for modern liquidity-based trading strategies.
A must-have for traders using concepts like liquidity grabs, mitigation blocks, or sweep-to-reverse trade models.
🔗 Best used in combination with:
✅ First FVG — Opening Range Fair Value Gap Detector: Pinpoint the day’s first imbalance zone for intraday setups.
✅ ICT SMC Liquidity Grabs + OB + Fibonacci OTE Levels: Confluence-based entries powered by liquidity logic, order blocks, and premium/discount zones.
Used together, these scripts form a complete Smart Money toolkit — helping you build high-probability setups with confidence, clarity, and clean charts.

Liquidity Fracture DetectorThe Liquidity Fracture Detector is an advanced tool designed to identify micro-liquidity traps and structural fakeouts on intraday charts. These occur when the market appears to break out, only to quickly reverse — often triggered by stop hunts, inefficient fills, or manipulated order flow.
The script combines volume spikes, volatility anomalies, and price structure breaks to signal "fractures" — points where the market temporarily breaks its behavior, often followed by strong reversals or trend accelerations.
Detection logic in the script:
Volume spike greater than 2x the average (adjustable)
Volatility spike: candle range is > 1.5x the average
Extreme wicks: wick is larger than the candle body (a classic trap signal)
Structure break: price breaks previous high/low but closes back within the old range
Combine these elements → a “fracture” is marked
Visual representation:
Red background = potential bull trap (fake breakout to the upside)
Green background = potential bear trap (fake breakdown to the downside)
A label appears at each fracture: “Echo” with the number of previous hits
Ideal use cases:
Intraday trading (1m, 5m, 15m)
Crypto, indices, futures, and forex
Detecting reactive zones where the market takes a false direction
Confluence with S/R zones, order blocks, or liquidity pools
Fully customizable:
Volume and range sensitivity
Heatmap intensity
Toggle labels on/off
Note:
This script is intended to support discretionary analysis. It does not provide buy or sell signals and is not an automated strategy. Combine it with your own price action or order flow setup for optimal results.

Wick Sweep EntriesWick Sweep Entry designed by Finweal Finance (Indicator Originator : Prajyot Mahajan) :
This Indicator is specially designed for Nifty, Sensex and Banknifty Options Buying. This works well on Expiry Days.
Setup Timeframe : 5m and 1m.
Entry Criteria :
For Long/CE :
Wait for Sweep of 5m Candle Low with next 5m Candle but you do not wait for the next 5 minute candle to close, you enter directly whenever any 1 minute candle of next 5minute candle to close above the low of previous 5m Candle.
For Short/PE :
Wait for Sweep of 5m Candle High with next 5m Candle but you do not wait for the next 5 minute candle to close, you enter directly whenever any 1 minute candle of next 5minute candle to close below the High of previous 5m Candle.
Key notes :
1. As this is the Scalping High Frequency Strategy, it is to be used for scalping purpose only. You might have losses too so to avoid the noise in the market, i suggest you to use this strategy in the first 45 minutes to 1 hour of Indian Markets as this is a volatility Strategy.
2. Although Nifty and Banknifty are independent indices, they still show some reactions with each other, so if you spot a long entry on BNF and Short Entry on nifty then you will avoid taking the trade, you will take the trade only if there is a tandem activity or At least the other index is not showing opposite signal.
3. If target is not hit and you spot another entry, you will avoid taking the new entry.
The Indicator will automatically spot/plot the entry signal, all you need to do is enter as soon as 1minute candle closes either below prior 5 minute candle High for Short/PE or closes above 5minute low for Long/CE.
For Targets :
You Can Target recent minor pull back, FVG, or Order blocks.
Remember : This is a scalping strategy so don't hold trade for more than 4/5 1minute Candles

Volumatic Trend [ChartPrime]
A unique trend-following indicator that blends trend logic with volume visualization, offering a dynamic view of market momentum and activity. It automatically detects trend shifts and paints volume histograms at key levels, allowing traders to easily spot strength or weakness within trends.
⯁ KEY FEATURES
Trend Detection System:
Uses a custom combination of weighted EMA (swma) and regular EMA to detect trend direction.
A diamond appears on trend shift, indicating the starting point of a new bullish or bearish phase.
Volume Histogram Zones:
At each new trend, the indicator draws two horizontal zones (top and bottom) and visualizes volume activity within that trend using dynamic histogram candles.
Gradient-Based Candle Coloring:
Candle color is blended with a gradient based on volume intensity. This helps highlight where volume spikes occurred, making it easy to identify pressure points.
Volume Summary Labels:
A label at the end of each trend zone displays two critical values:
- Delta: net volume difference between bullish and bearish bars.
- Total: overall volume accumulated during the trend.
⯁ HOW TO USE
Monitor diamond markers to identify when a new trend begins.
Use volume histogram spikes to assess if the trend is supported by strong volume or lacking participation.
A high delta with strong total volume in a trend indicates institutional support.
Compare gradient strength of candles—brighter areas represent higher-volume trading activity.
Can be used alone or combined with other confirmation tools like structure breaks, liquidity sweeps, or order blocks.
⯁ CONCLUSION
Volumatic Trend gives you more than just trend direction—it provides insight into the force behind it. With volume-graded candles and real-time histogram overlays, traders can instantly assess whether a trend is backed by conviction or fading strength. A perfect tool for swing traders and intraday strategists looking to add volume context to their directional setups.

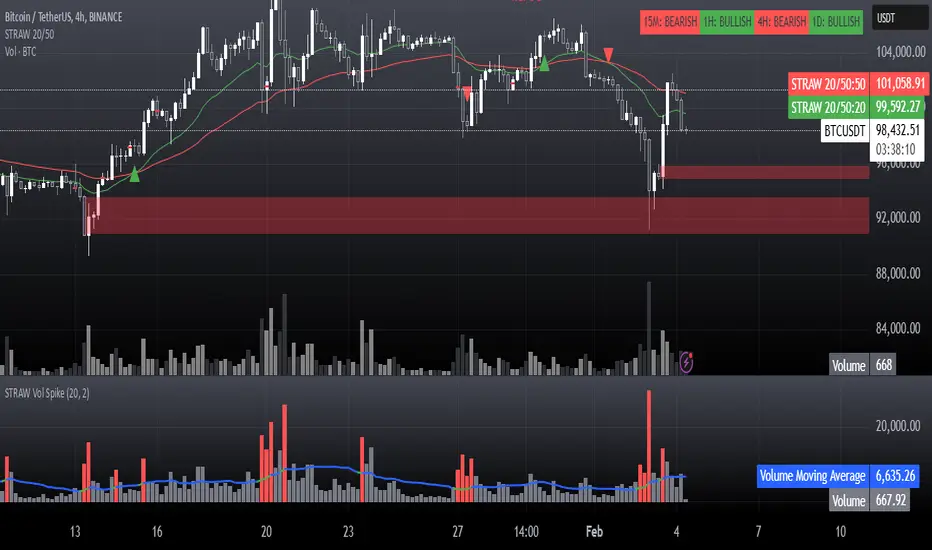
STRAW Volume Spike IndicatorThis is basically a:
High-Volume Impulse Detector
The High-Volume Impulse Detector is a refined tool designed to highlight key moments of explosive volume surges in the market, specifically calibrated for assets like Bitcoin on the 15-minute timeframe. Unlike generic volume-based indicators, this script doesn’t just flag high volume—it intelligently adapts to market dynamics by incorporating a custom-moving average baseline and highlighting instances where volume exceeds a significant threshold relative to the average.
Key Features
✅ Adaptive Volume Benchmark – Uses a dynamic moving average to filter out noise and pinpoint meaningful volume spikes.
✅ Impulse Confirmation – Only highlights volume bars that exceed the 50% threshold above the baseline, ensuring signals capture real liquidity shifts.
✅ Smart Color Coding – Differentiates high-impact bullish and bearish volume with distinct visual cues for easy market structure identification.
✅ Designed for Order Block Traders – Helps validate liquidity-driven price movements essential for refining order block and break-of-structure strategies.
Unlike conventional volume overlays, this tool helps traders connect volume surges to key structural shifts, making it an ideal companion for those navigating momentum shifts, market inefficiencies, and institutional footprints.
⚡ Best used on BTC 15m for tracking aggressive volume-driven moves in real-time.
US30 Q4_trade _levels_Jan2025updated description and use
US30 Trade Levels.plus 50% take profit levels
this indicator is based on the US30 quarterly theory level strategy
the difference here is that the zones have been zoom'd out for the H2 view for oversight and M30 as application theory to the Q4 levels.
The Q4 levels are spaced and calculated 385 pips apart, and also span within the daily ADR range for US30.
so these are zones that has proven to be valid going back as far as Nov2022
these are pass through levels, to together with other confluences like order blocks and or breaker blocks, will give you a guideline as to expect a valid zone of interest.
USE this indicator in conjunction with an SMC point of view to identify OB & CHOCH

Advanced Volume-Driven Breakout SignalsThe "Advanced Volume-Driven Breakout Signals" indicator is a cutting-edge tool designed to help traders identify high-potential trading opportunities through sophisticated volume analysis techniques. This indicator integrates volume flow analysis, moving averages, and Relative Volume (RVOL) to provide a comprehensive view of market conditions, going beyond traditional Volume Spread Analysis (VSA) methods.
Key Features:
Volume Flow Analysis: Distinguishes bullish and bearish volume flows with distinct colors, making it easier to visualize market sentiment and potential breakout points.
Volume Flow Moving Averages: Calculates moving averages for volume using various methods (SMA, EMA, WMA, HMA, VWMA), accommodating different trading strategies. This includes settings for adjusting the type of moving average and its period, as well as thresholds for high, medium, and low volume levels.
Volume Spikes Detection: Identifies significant volume spikes based on user-defined multipliers and moving averages, highlighting unusual trading activity.
Volume MA Cloud Settings: Computes general moving averages of volume to track trends and detect deviations. This feature includes options to select different moving average types and adjust thresholds for detecting high volume activity.
Relative Volume (RVOL): Measures current volume relative to historical averages, triggering signals when RVOL exceeds predefined thresholds, indicating notable changes in trading activity.
Entry Conditions: Provides clear long and short entry signals based on combined volume flow conditions and RVOL, offering actionable trading opportunities.
Volume Visualization:
— Bullish Volume Flow: Light and dark green bars indicate bullish volume flow.
— Bearish Volume Flow: Light and dark red bars denote bearish volume flow.
— High Volume Bars: Highlighted in yellow, and extreme volume bars in orange for additional context. These bars are plotted for visual aid and do not directly influence trade signals, focusing instead on the quality and strength of the volume flow.
Alerts: Allows users to create alert notifications for long and short entry signals when the criteria are met, enabling traders to respond promptly to trading opportunities.
Usage:
Overlay: Apply the indicator directly to your price chart to visualise real-time signals and volume conditions.
Customisable: Adjust settings for moving averages, RVOL, and other parameters to match your trading strategy and preferences.
Comparison to VSA Scripts: The "Advanced Volume-Driven Breakout Signals" indicator extends beyond traditional VSA scripts by incorporating a wider range of analytical features. While VSA primarily focuses on volume spread patterns and price action, this indicator offers enhanced functionality with advanced RVOL metrics, customizable moving averages, and detailed volume spike detection, making it a more versatile tool for identifying breakout opportunities and managing trades. It is particularly effective when used alongside key levels and order blocks.
Acknowledgements: Special thanks to @oh92 and @goofoffgoose for their invaluable scripts, which served as inspiration in the development of this advanced trading indicator.
Notes: The script is continually evolving, with ongoing refinements aimed at enhancing accuracy and performance.
